Analytics / 01 of 03
Sales Dashboards
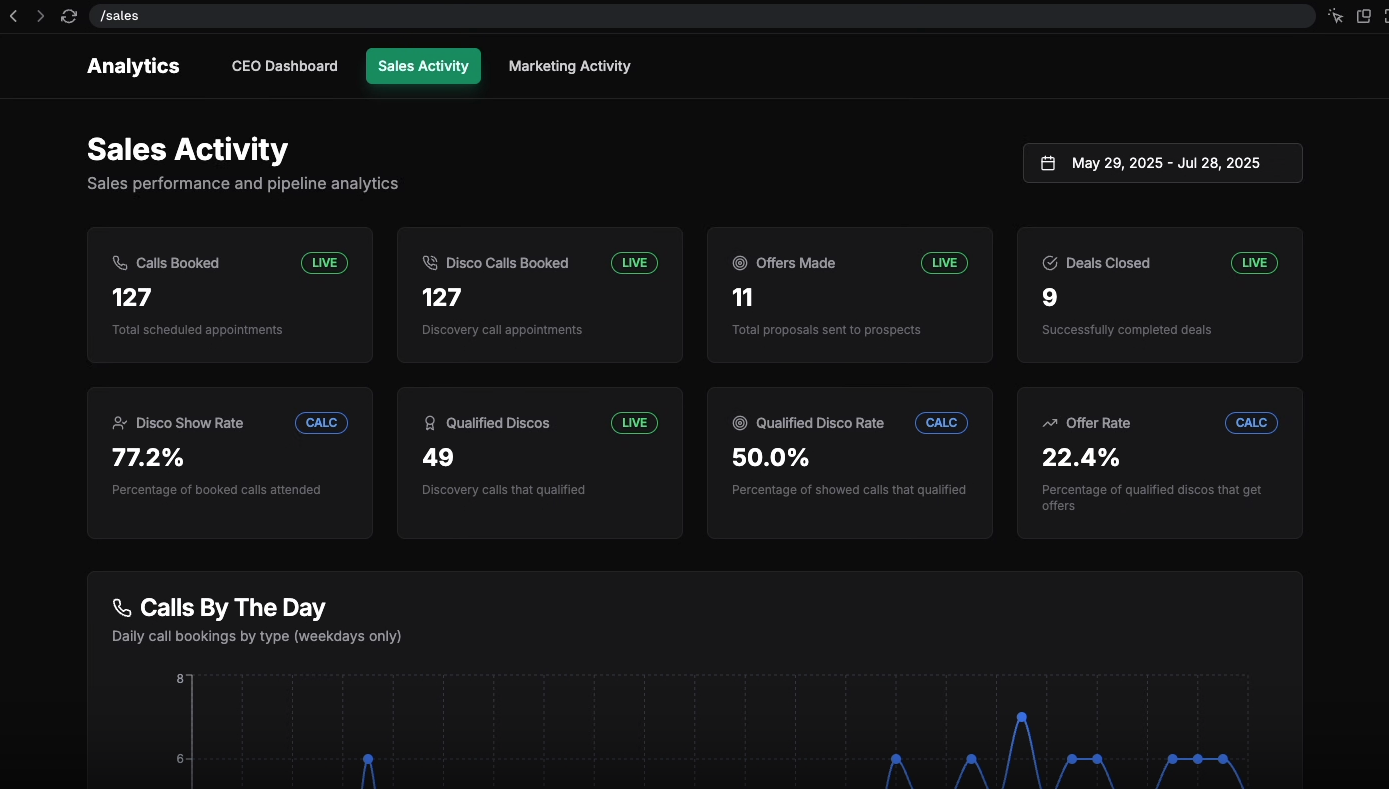
Understand your lead volume, cost per qualified call, acquisition costs, and higher level stats at a glance so you can make better decisions about the pipeline.
How it runs
Sources
Five sources
Parallel — 5 jobs
- Ad platform spend
- Funnel opt-ins
- CRM activity
- Call outcomes
- Closed deals
Step 01
Upsert into the reporting store
Store tables
Leads, events, calls, deals, ads
Dashboard
Leads, cost/qual call, close, CAC
What it is
Ad spend, opt-ins, bookings, call outcomes and closed deals landing in one reporting store, so you can see cost per qualified call rather than cost per lead.
You need this if your marketing numbers live in the ad platform and your sales numbers live in the CRM, so nobody can compute the metric that decides ad spend.
You end up scaling a channel that produces cheap leads and expensive customers.
If you're already running paid, this turns budget decisions into arithmetic instead of argument.
The actual build
What it does for you
Spend joins to closed revenue
so you can scale the channel that produces customers rather than the one that produces leads.
Show rate, qualified rate and close rate by rep and by source sit in one place
which is where the real bottleneck usually turns out to be.
The pipeline number becomes reliable enough to forecast from
so hiring and spend get planned rather than guessed.
Built and running
STAXX
Dylan HendricksonLivewe have way better access to the data now than we did beforehand… we're able to get a lot of data on the show rate and the qualified rate." On the stakes: "if we don't have the data we need on the sales side, how do we know what bottleneck to attack?
Show rate ~30% → 65%+, business doubled in a single month (Jan → Feb '25), clients ~25 → ~70
Want this one built into your business?
Thirty minutes, no deck. We map what you run today and tell you what it would take.