Analytics / 02 of 03
Operations Dashboards
Get the 30,000ft view of the fulfilment team's activity so you can see work volume, team capacity and process bottlenecks at a glance
How it runs
Inputs
Work items, assignments, time
Parallel — 3 jobs
- By person: load, capacity
- By stage: where queues pile
- By client: ahead or behind
Three roll-ups, three questions a lead asks
Step 01
Dashboard
Alerting
Overdue, over-capacity, stalled
What it is
One view of what the fulfilment team is carrying, meaning load per person, queue per stage and status per client, with alerts on anything needing a decision.
You need this if you can't see who's overloaded until they tell you, because then you're managing capacity from complaints.
Both failure modes cost money: paying for spare capacity you can't see, or losing a good operator you didn't notice was drowning.
If you already look at the board daily, the roll-up turns looking into deciding.
The actual build
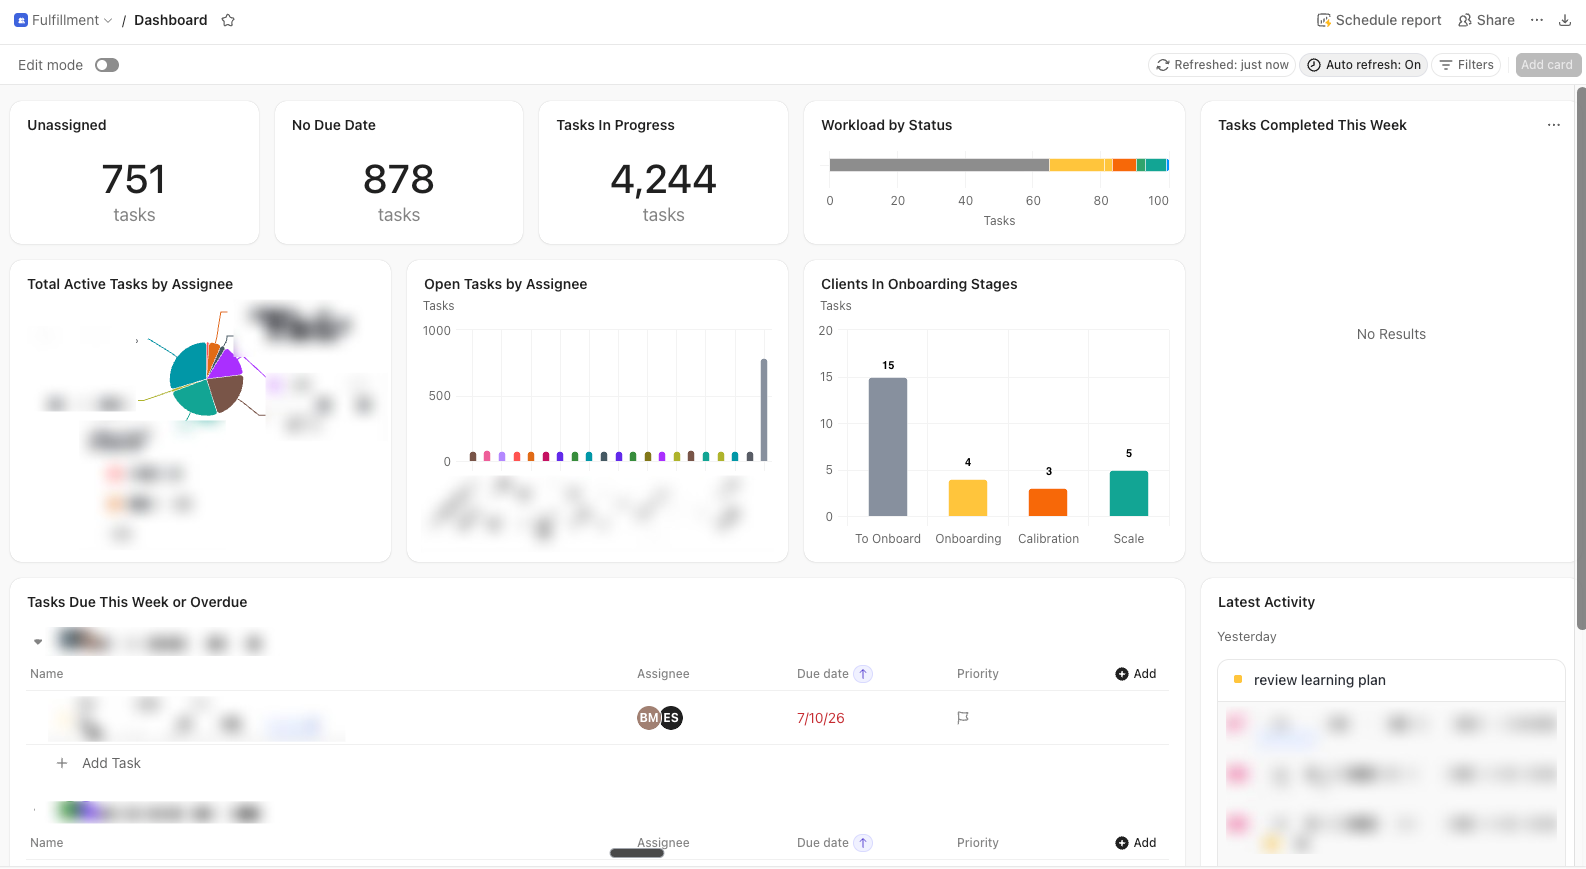
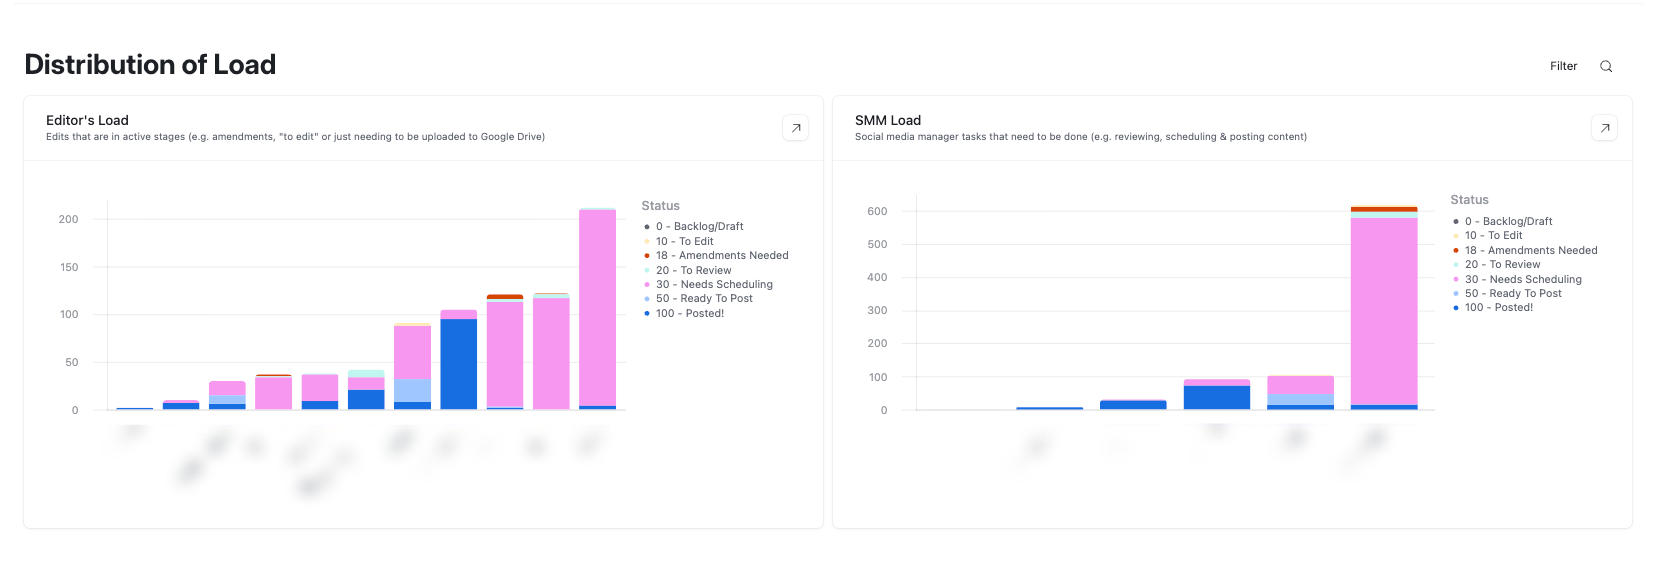
What it does for you
Spare capacity shows up as a number
so you can take on more work without hiring against a guess.
The stage where the queue stacks up becomes obvious, and that's where throughput is actually being lost
The overloaded person gets flagged before they raise it, usually several weeks before they'd have told you
Built and running
GP Socials
Braden RicchiniLivebefore, I had no idea what was going on. I didn't know which editors had the most work on their plate, what stuff is overdue. So now I am able to see which editor has extra capacity, which can help us relative to margins.
Daily admin ~1 hour → ~10 minutes, ~$10–15k/mo → a $50k month
Want this one built into your business?
Thirty minutes, no deck. We map what you run today and tell you what it would take.