Analytics / 03 of 03
Analytics Dashboards
Measure your clients' views, calls, revenue and other metrics directly attributable to your service so that you can prove and calculate the ROI on your service
How it runs
Scheduled
Scheduled pull from platforms
Parallel — 4 jobs
- Social
- Ads
- Ticketing
- CRM
Pulled from the client's own platforms
Attribute
Attribute metrics to your work
Step 02
Per-client dashboard
Client view
Client-facing view
Internal
Internal ROI vs promise check
Handoff
Feeds the churn-risk system
What it is
Client-side metrics pulled on a schedule and tied back to the specific work that produced them, so ROI gets calculated rather than claimed.
You need this if renewal conversations open with the client asking what they got for the money, because you've already lost the frame.
Proving value at renewal is far harder than proving it continuously.
If you already report metrics, attribution is the missing half: views are a number, views caused by the thing you shipped are an argument.
The actual build
What it does for you
Your ROI gets proven with the client's own numbers
which is the only version of the renewal conversation you want to have.
Delivery falling short of the promise gets flagged internally weeks before the client raises it
A library of real, attributable results builds up
which is what makes case studies and price increases defensible.
Built and running
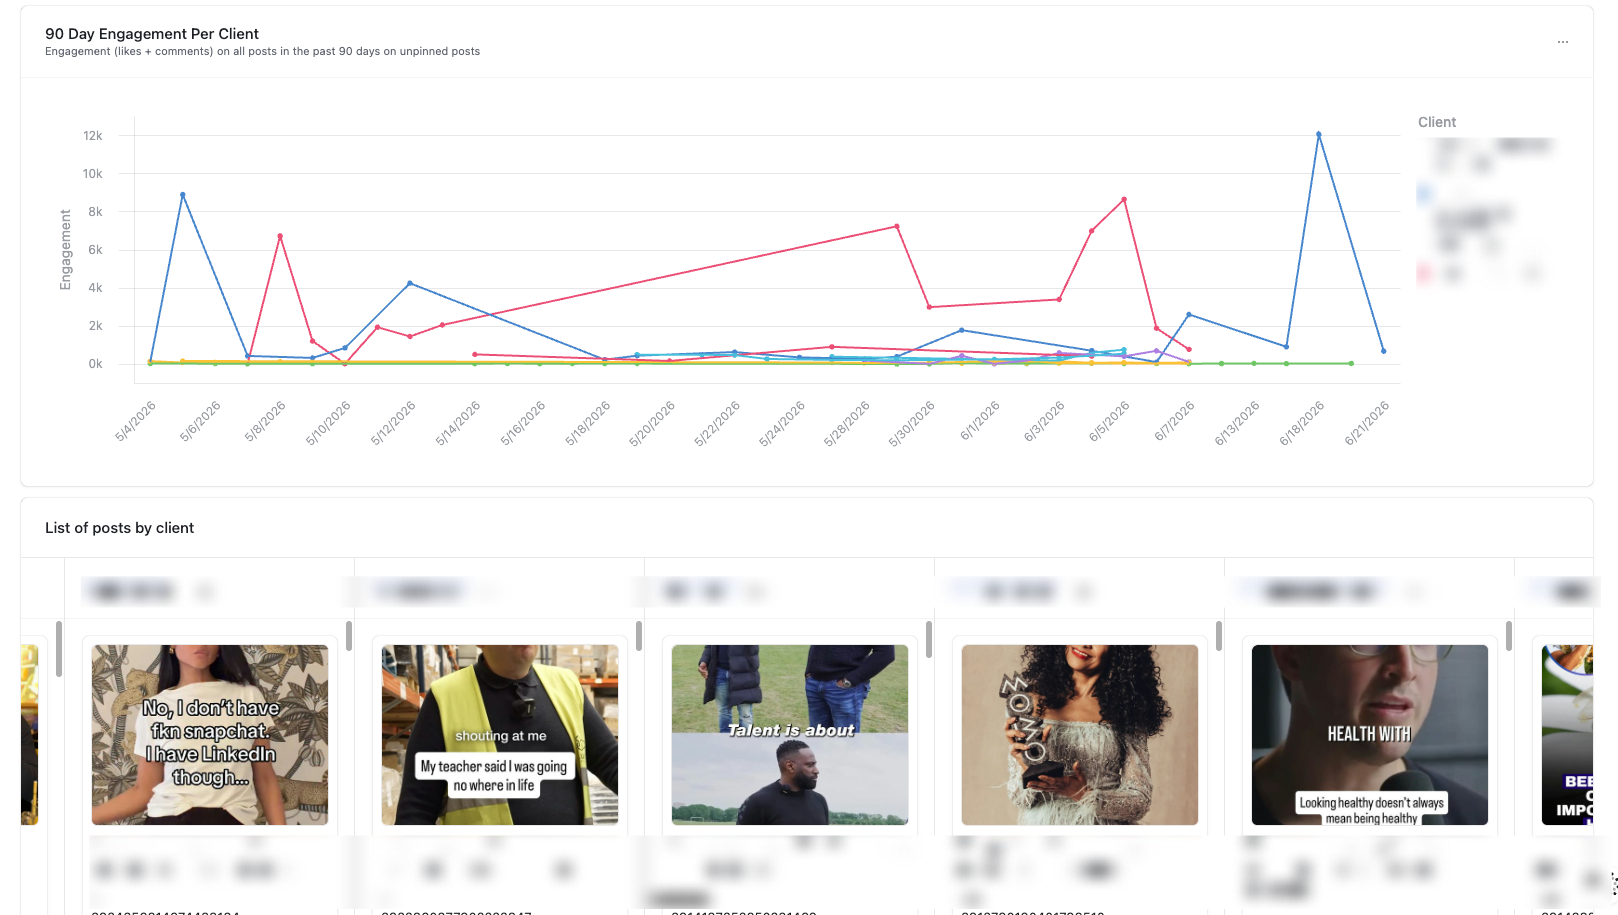
Your Social Currency got a daily Instagram scrape into a top-5 and bottom-5 analytics dashboard by engagement, views and likes. The Festival Company got ShowPass ticket-sales webhooks plus Facebook and Instagram metrics into one dashboard across two events and two provinces, with a 42,000 monthly audience
Liveto surface any time that we're not hitting our delivery promise that puts us at risk.
School of Bots got per-client ROI tracking, used specifically
Want this one built into your business?
Thirty minutes, no deck. We map what you run today and tell you what it would take.